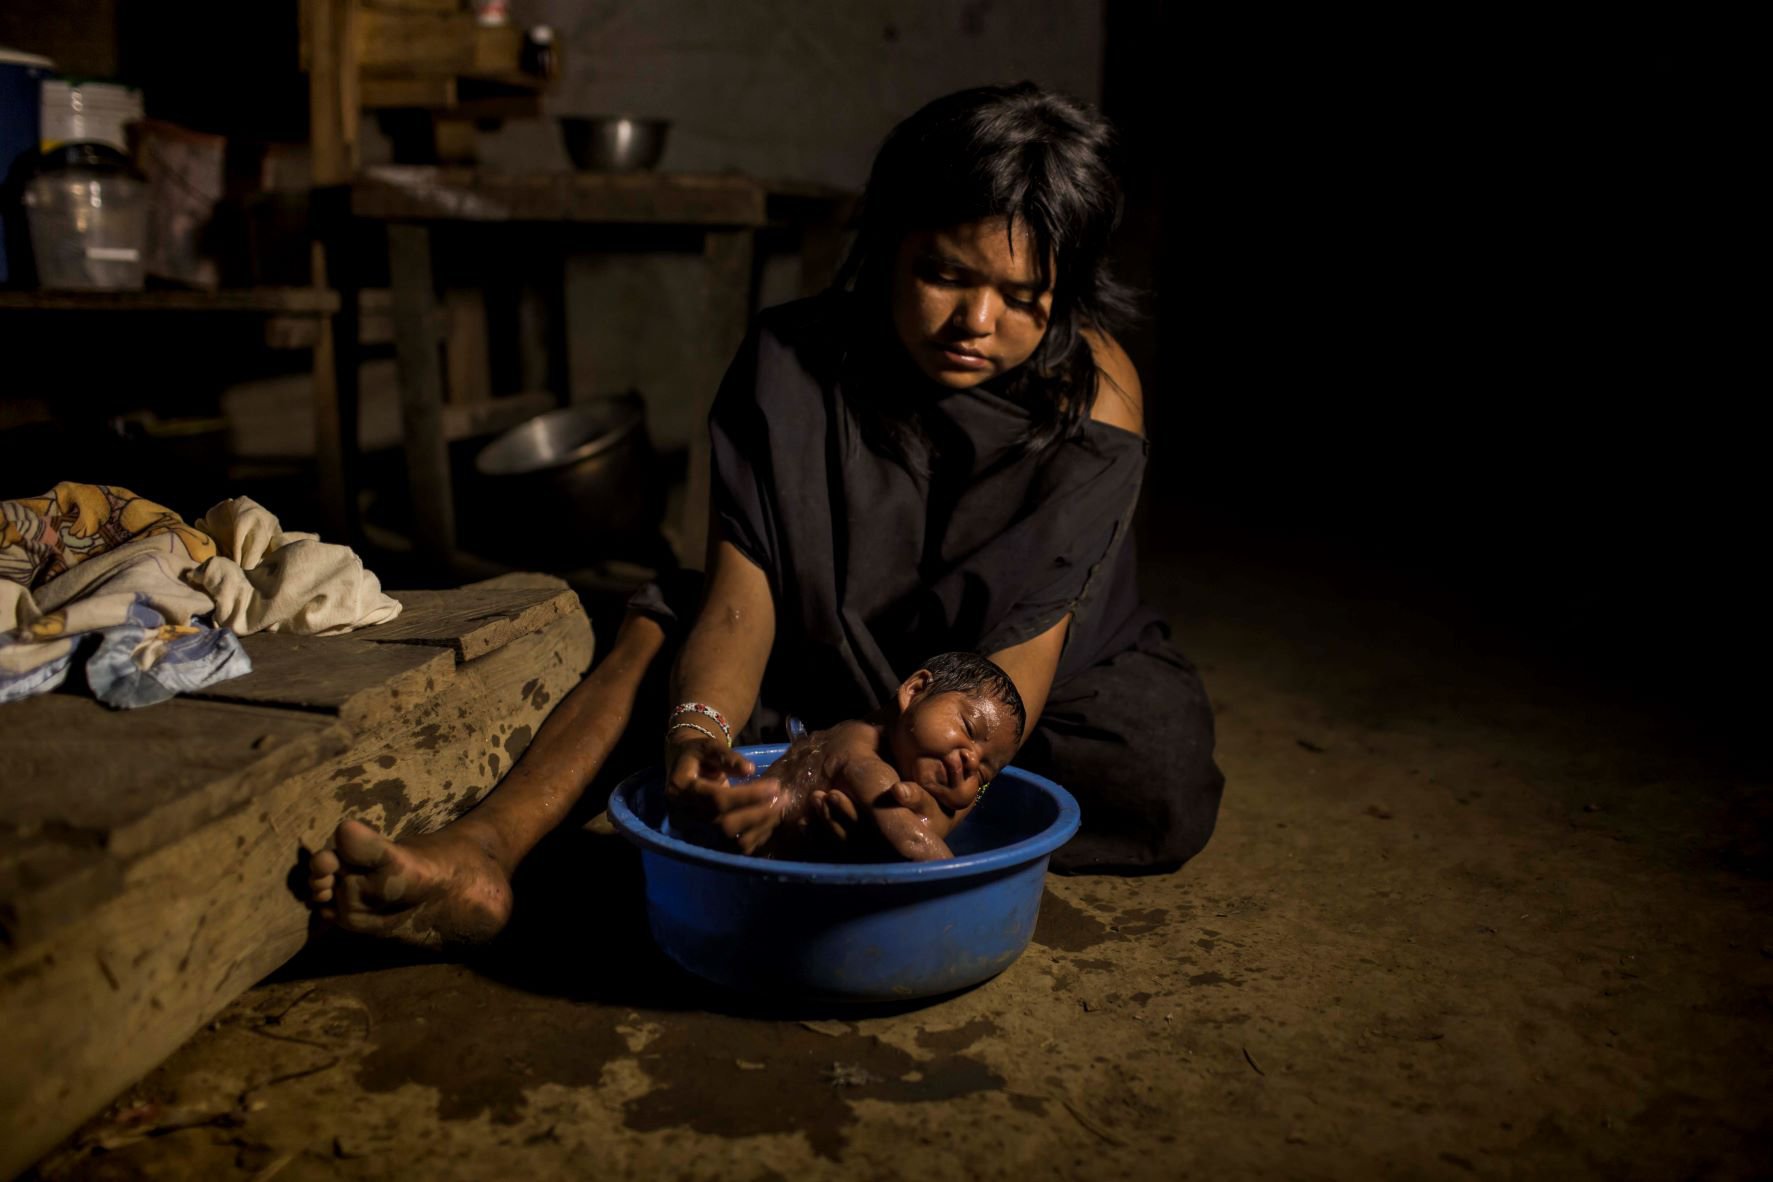
The Other Peru is a piece of investigative journalism that sheds light on the impact of the Covid-19 pandemic on the indigenous peoples of the Peruvian Amazon. The result—a digital platform that combines interactive graphics and reports—shows the role that data analysis can play in detailed coverage. It also demonstrates how transparency mechanisms—such as freedom of information legislation—can help close the information gaps that otherwise increase the isolation suffered by native populations.
The project built and analyzed databases containing information from various reliable sources to prepare a detailed study of the situation facing native communities in five regions or departments: Loreto, San Martín, Madre de Dios, Ucayali, and Amazonas.
The selection criteria required areas entirely located in the Amazon, with indigenous peoples constituting a significant percentage of the population. However, based on the Ministry of Culture of Peru (MINCUL) records, the project’s scope later expanded to take in other regions housing Amazon indigenous communities, such as Cusco, Junín, and Huánuco.
An in-depth examination
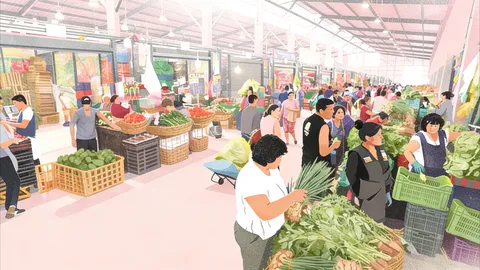
With maps, statistical graphics, and other visual representations, the platform provides information in various layers to help understand the conditions in which native communities are living as the pandemic unfolds. This is a topic mostly overlooked by mainstream media, whose coverage tends to have an urban bias.
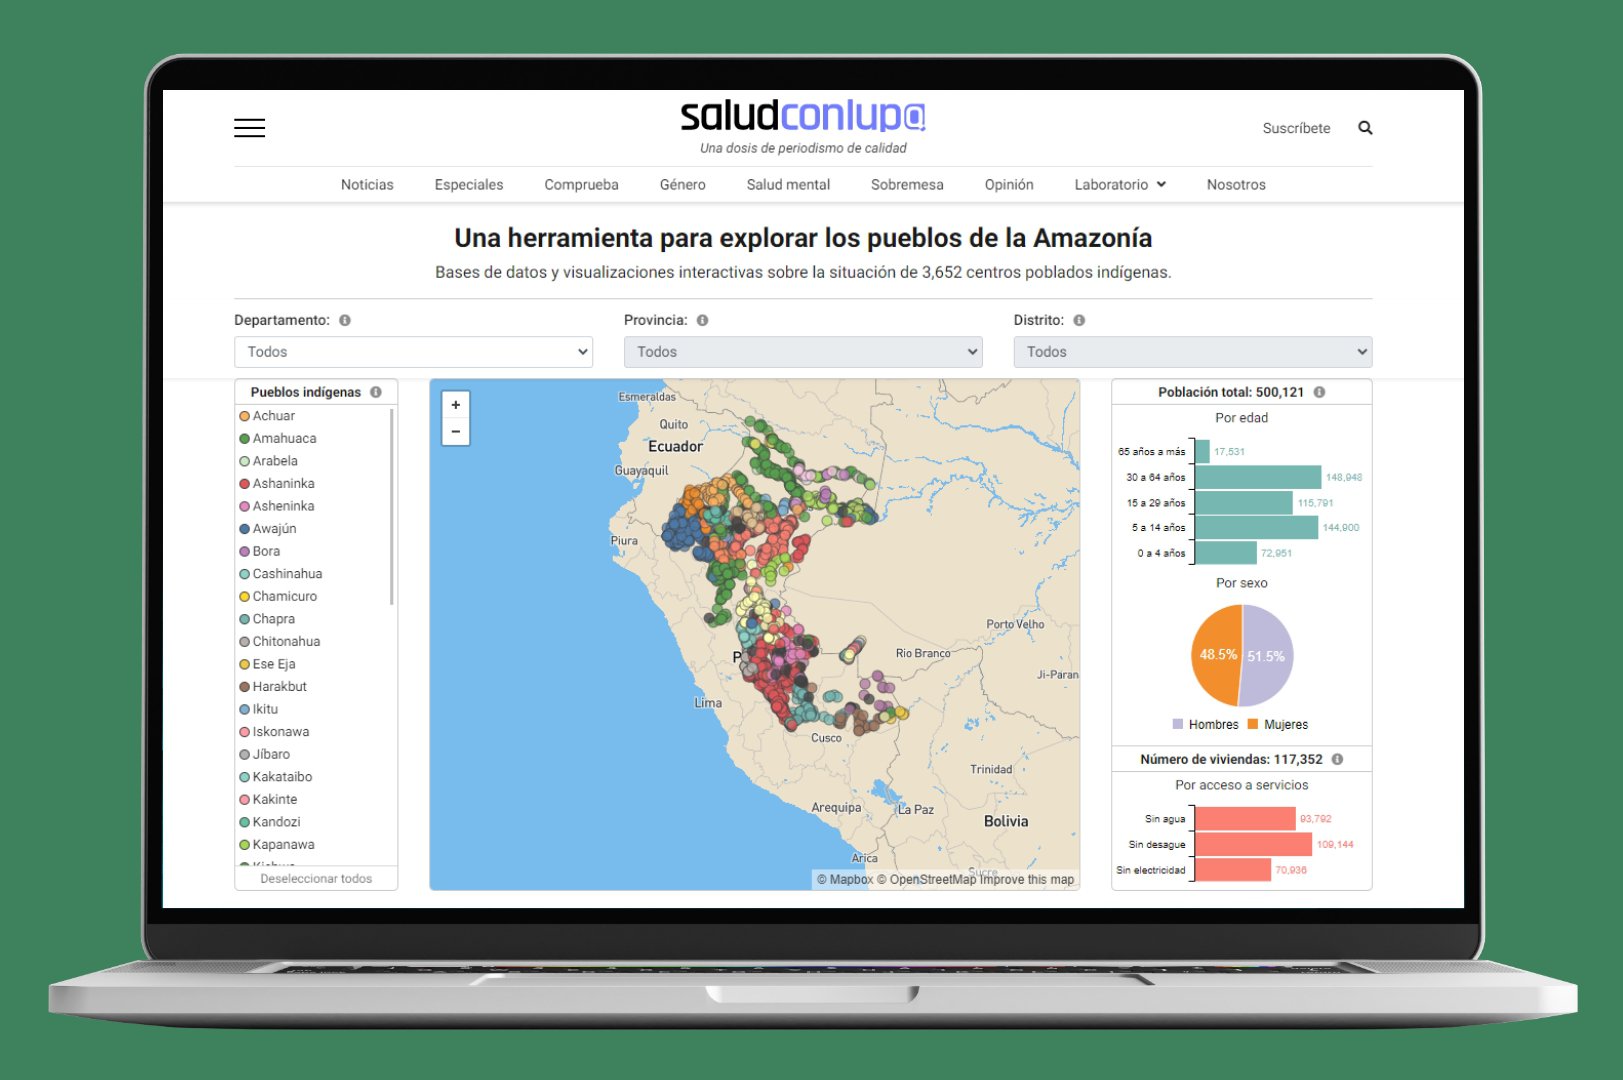
At the first layer, the user can find—by district—the location of population centers inhabited by various Amazon ethnic groups. This mapped data also shows the location of the various types of health facilities in each district and also demographic, economic, and social data, such as access to basic services.
At the second layer, the platform enables the user to monitor the progress of the Covid-19 vaccination program in the native populations of each district. At the third level, the platform displays the incidence of endemic infectious diseases in the Peruvian Amazon: Zika, dengue, malaria, and chikungunya. Finally, it breaks down, by indigenous group and by district, the number of infections and deaths due to the pandemic.
The information trickles in
The work began with data collection, made difficult by a lack of information from official sources because health authorities failed to build ethnic identity into their approach. Although they later corrected this oversight, they did not then make the associated data freely available to the public. “The Ministry of Health did not have historical [data] on vaccination in indigenous peoples,” says Jason Martínez, Head of Technology and co-founder of Salud con Lupa (Health under a magnifying glass), a collaborative journalism digital platform aimed at public health.
José Luis Huacles, a Salud con Lupa data journalist, says obtaining the necessary indicators required several information requests to the Ministry of Health (MINSA). The procedure for such requests is included in the 2002 Transparency and Access to Public Information Law, obliging the State to provide citizens with any information they require, provided it is unclassified.
MINSA provided unsatisfactory results. On vaccination, the ministry reported that it did not have a specific plan for indigenous communities. On other matters, it suggested consulting regional authorities or reviewing the so-called Indigenous Situation Room. The latter is a web platform created by the national government that presents snapshots of Covid-19 case and death numbers by community, ethnic group, and geographic district. However, the platform did not allow downloading of raw data, and, in some instances, gave incomplete information.
We sent requests for access to information to the regional health directorates (DIRESA), which are decentralized bodies administratively attached to regional governments. We attempted to contact the directorates of the five priority regions, but once again encountered barriers. None of the websites included the name of the responsible official or a form for our type of request. The same problem arose on the regional government websites. The government of Amazonas did take our request but then never responded. Ultimately, only two regions responded: Ucayali and San Martín. Each provided information on the number of infections and deaths, having had the foresight to record ethnic group in their Covid-19 statistics.
Data crosschecking
As Jason Martínez explains, instead of organizing the data by native communities, we opted to do so at the district level, where indigenous localities could be located. This approach required crosschecking of the databases of various entities. Since MINCUL’s website was not up to date, we placed a freedom of information request for its indigenous peoples database, thus establishing relationships and georeferenced locations of indigenous population centers. The information included data on basic services coverage, such as water, sewage, and electricity.
We also approached MIDIS because of its digital platform that shows, among other indicators, the percentage of homes at district level with access to essential services and the percentage of minors vaccinated under the basic immunization regime. We successfully made an access to information request to obtain components of the tool not ordinarily available to the public so as to download data and apply different filters.
We also consulted the National Registry of Health Service Provider Institutions (RENIPRESS) and a database of the National Superintendency of Health (SuSalud). The latter is a publicly accessible search engine containing georeferenced data by category and territory (departments, provinces, and districts) about all the country’s health facilities, whether public or private. We also consulted the National Registry of Health Personnel (INFORHUS). Comparing all this information, we could determine how many people work in each establishment and identify their professions. Most Amazon communities have access only to category I-1 establishments (stand, health post, or clinic with non-medical health professionals) or category I-2 (health post, or post with doctor).
Finally, we examined information from the National Institute of Statistics and Informatics (INEI), specifically, the 2017 Census of Native Communities 2017, which serves as a source for part of the MINCUL data. Using the census, researchers can estimate the socioeconomic conditions of the indigenous population. The census includes other relevant data, such as educational level and language.
As we had decided to work with georeferenced data and present it using interactive maps, we contrasted the information on territorial demarcations with the ubigeos held by the National Registry of Identity and Civil Status (RENIEC). The ubigeo—an acronym for “geographic location”—is a code created by the Peruvian government to identify each district precisely.
Processing and development
Using OpenRefine software, we cleaned up and standardized the databases, a process that allowed us to save the information in CSV format files and facilitated its tabulation.
We relied on the Jupyter Lab platform—which uses the Python programming language—to process, analyze, and crosscheck the databases, making it possible to create sequences to automate information processing. We also used the Pandas, Numpy, and Matplotlib libraries together with Jupyter Lab for data exploration and transformation. As is well known, a library is a set of scripts or lines of code that can be reused to perform specific tasks.
This sequence of actions enabled us to develop the web platform described above, in which the user can navigate on a map and explore views of the different databases through filters by department, province, and district. We prepared these visualizations using JavaScript libraries, such as D3.js and Leaflet.js.
The result is a powerful and user-friendly tool that contributes to understanding the challenges indigenous communities face today in the Peruvian Amazon. This tool—which we have made public together with various other pieces of journalism—is a contribution not only to the work of researchers interested in this often-forgotten sector of the country’s population but, above all, to decision-making. With more precise and complete information, better public policies are possible.
This story was produced with the support of the John S. Knight Journalism Fellowships and Big Local News at Stanford University.